


Era over Era: The 2020s Home Price Surge Compared to Decades Past

Lena Pesso
It’s been 10+ years for me in the real estate business. I love it ❤️...
It’s been 10+ years for me in the real estate business. I love it ❤️...
The 2020s housing market continues to defy expectations. National home prices have surged over the past four years, surpassing growth experienced in entire previous decades. This rapid climb has many wondering – is this a sustainable trend, or are we due for a correction?
Today, we are diving into the historical data and exploring what this means for you.
2020s Home Price Growth: Surpassing Expectations
National home price growth in the early 2020s has already outpaced the total growth seen in both the 1990s and 2010s. According to ResiClub's analysis of the latest data, U.S. home prices have increased by 47.1% through the first 50 months of this decade.
Even the past year alone has seen considerable growth: U.S. home prices increased 6.4% from February 2023 to February 2024.
Locally in Livingston, NJ we are seeing even more of a price increase trend. In April 2023, the average home sale price YTD was $994,022. Fast forward a year, and the average home sales price YTD was $1,263,643, a 27% increase year-over-year.
So, what does this mean for the rest of the decade? To gain a better perspective, let’s dive into some historical data.
Historical Comparisons
The 2020s increase in home prices can bring up a lot of fears (especially for those who see all the doom-and-gloom headlines!). We often hear questions like: Does this mean a market crash is coming? Is this a bad time to buy? Should I just wait for prices to come down?
Historically, here’s what we’ve seen: a consistent upward trend in home price growth every decade.
Take a look at the national numbers:
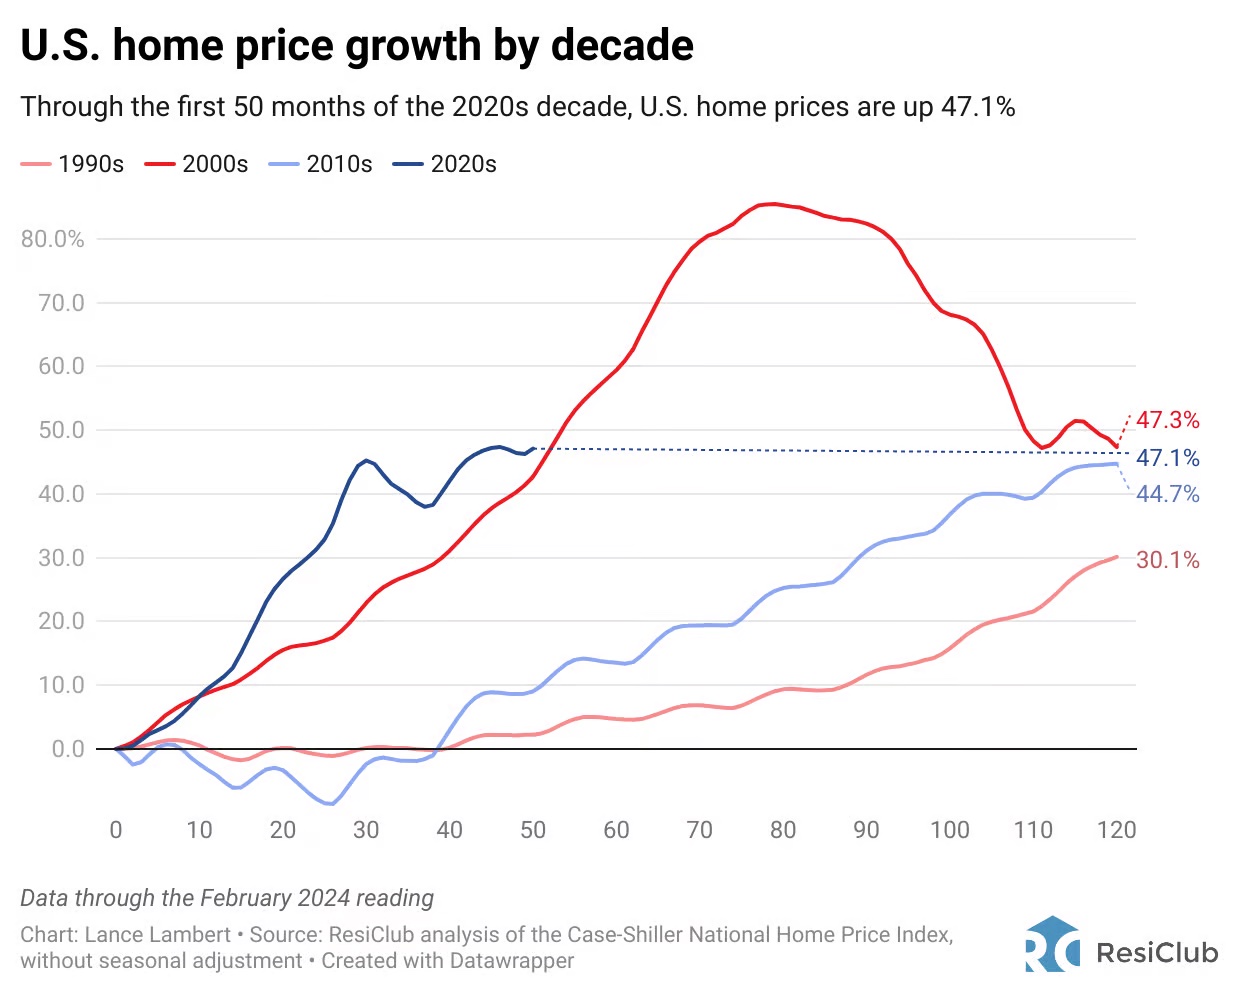
- 1990s Decade: +30.1% increase in home price growth
- 2000s Decade: +47.3% increase
- 2010s Decade: +44.7% increase
- 2020s Decade: +47.1% increase (in just the first 50 months)
In short, the 2020s market (so far) is an outlier, as we’re seeing higher overall price inflation in the current decade compared to similar points in previous decades. However, we also know that long-term, home price appreciation is expected to continue.
What does this mean for you?
The historical data suggests a few key takeaways:
- Long-term Investment: The consistent upward trend across decades highlights the value of real estate as a long-term investment. Even periods of correction are generally followed by recovery and growth, reinforcing the asset's stability.
- Housing Market Dynamics: Buyers and sellers must stay informed about local market conditions, as national trends can mask regional variations. For example, some markets are currently experiencing an increase in housing inventory, while others remain at record lows.
- Future Outlook: With the market showing no signs of a significant downturn, strategic investments can still yield substantial returns. But, as with any significant purchase, careful analysis remains essential.
Final Thoughts
We know the current market may seem daunting, but here’s the upside: history suggests that real estate remains a strong long-term investment.
However, with national trends masking regional variations, it’s critical to stay informed about your local market. After all, understanding local dynamics—including prime locations, market data and up-and-coming neighborhoods—is the key to leveraging the potential of real estate for long-term gains.
Want to dive deeper?
Curious to know how the numbers look for your particular town?